Carbon stored in live ponderosa pines in the Sierra Nevada will not return to pre-drought (2012) levels during the 21st century due to bark beetle outbreaks
 Zachary J. Robbins1,2*
  Chonggang Xu1
  Alex Jonko1 Rutuja Chitra-Tarak1
  Christopher J. Fettig3 Jennifer Costanza4 Leif A. Mortenson3
  Brian H. Aukema5
  Lara M. Kueppers6
  Robert M. Scheller2
- 1Earth and Environmental Science Division, Los Alamos National Laboratory, Los Alamos, NM, United States
- 2Department of Forestry and Environmental Resources, North Carolina State University, Raleigh, NC, United States
- 3Pacific Southwest Research Station, USDA Forest Service, Davis, CA, United States
- 4Southern Research Station, USDA Forest Service, Research Triangle Park, NC, United States
- 5Department of Entomology, University of Minnesota, Saint Paul, MN, United States
- 6Energy and Resources Group, University of California Berkeley, Berkeley, CA, United States
Outbreaks of several bark beetle species can develop rapidly in response to drought and may result in large transfers of carbon (C) stored in live trees to C stored in dead trees (10s of Tg C yr-1 in the western U.S. alone), which over time will be released back to the atmosphere. The western pine beetle (WPB) outbreak incited by the 2012–2015 mega-drought in the Sierra Nevada, California, U.S., could portend more frequent and/or severe bark beetle outbreaks as the temperature warms and drought frequency and intensity increase in the future. However, changes in the frequency and/or severity (resultant levels of host tree mortality) of beetle outbreaks are difficult to predict as outbreaks are complex with non-linear and eruptive processes primarily driven by interactions among beetle populations, the demography of hosts and other tree species, and climate and weather. Using an insect phenology and tree defense model, we projected the future likelihood of WPB outbreaks in the Sierra Nevada with climate drivers from different Earth System Models. Our goal was to understand how host (ponderosa pine, PIPO) recovery and future warming and drought affect the frequency and severity of WPB outbreaks and their C consequences. Our projections suggested that by 2100 the C stored in live PIPO (mean: 1.98 kg C m-2, 95% CI: 1.74–2.21 kg C m-2) will not return to levels that occurred before the 2012–2015 drought (2012: ∼2.30 kg C m-2) due to future WPB outbreaks. However, differences in climate models indicate a wide range of possible WPB outbreak frequencies and severities. Our results suggest that total plot basal area is the most significant factor in the mortality rate of PIPO by WPB in any given year, followed by drought severity and temperature. High levels of host basal area, higher temperature, and extreme drought all contribute to the frequency and severity of future WPB outbreaks. While PIPO basal area may decline under increased drought and warming, limiting high-stand basal area (>60 m2 ha-1) may reduce the severity of future WPB outbreaks in the Sierra Nevada.
1 Introduction
The preservation of carbon (C) in forest ecosystems is a key component of mitigating C emissions and combating climate change (Houghton and Nissakas, 2018). However, the risk of C emissions caused by forest disturbances (which may increase in a hotter and drier climate) must be accounted for when estimating C budgets (Hurteau et al., 2019). In the U.S., forests annually sequester >11% of economy-wide greenhouse gas emissions (Domke et al., 2022). However, in recent decades the rate of forest C sequestration has slowly declined due to increasing frequency and severity (the resultant levels of tree mortality) of disturbances, leading to abrupt (e.g., wildfire) and/or gradual transfers of C to the atmosphere and dead organic matter pools. Bark beetle (Dendroctonus spp., and to a lesser extent Ips spp. and Scolytus spp.) outbreaks are a fundamental disturbance in temperate conifer forests in the U.S. (Fettig et al., 2022), and climate change has increased the impacts of some bark beetles on forests (Bentz et al., 2010). In short, bark beetles represent an annually fluctuating source of tree mortality, ranging from 5 to 45 Tg C yr-1 across the western U.S., depending on the severity and extent of outbreaks (Hicke et al., 2012). Many forests regain most of the C emitted through regrowth, resulting in a mostly C-neutral process (McKinley et al., 2011). However, shifts in disturbance regimes may push forests into state changes or extirpation, thus altering their ability to sequester and store C (Raffa et al., 2008; Johnston et al., 2016; Serra-Diaz et al., 2018).
The 2012–2015 drought in forests of the Sierra Nevada, California, U.S., and the multi-year bark beetle outbreak that resulted from it, could foreshadow the impacts of future bark beetle outbreaks as the temperature warms and drought frequency and intensity increase (Fettig et al., 2019; Madakumbura et al., 2020). During this period, an estimated 129 million trees died (Bulac et al., 2017). The patterns of tree mortality, including the tree size classes and species killed, strongly suggest that bark beetle host selection played a dominant role in determining which trees died (Stephenson et al., 2019). Fettig et al. (2019) assessed causal agents and rates of tree mortality during and after the 2012–2015 drought based on a robust network of 180 fixed-radius plots within three elevation bands on the Eldorado, Stanislaus, Sierra, and Sequoia National Forests where tree mortality was most severe. About 49% of trees died between 2014 and 2017. Ponderosa pine (Pinus ponderosa; PIPO) exhibited the highest mortality levels among all tree species (89.6%), with 39.4% of plots losing all PIPO. Mortality of PIPO was highest at the lowest elevations, concentrated in larger-diameter trees, and attributed primarily to colonization by western pine beetle (Dendroctonus brevicomis; WPB) (Fettig et al., 2019). During the peak of the WPB outbreak (2015–2016), an estimated ∼46.3 Tg C was transferred from the live C pool (C stored in live trees) to the dead C pool resulting in future emissions through decay, decomposition, and wildfires (Sleeter et al., 2019).
Regional bark beetle outbreaks, like that of the Sierra Nevada, are thought to occur because of an imbalance between bark beetle attacks and host defenses driven by interactions among climate, weather, trees, and beetles. Regional drought is often observed as a catalyst for bark beetle outbreaks as water-stressed hosts reduce C assimilation compromising tree defense mechanisms (McDowell et al., 2011; Kolb et al., 2016; Huang et al., 2020). High levels of tree competition, resulting from high densities, limit trees’ abilities to access water, light, and nutrients and thus increase their susceptibility to bark beetles (Fettig et al., 2007; Goulden and Bales, 2014). Warming accelerates beetle life cycles and decreases overwintering mortality of some species (Bentz et al., 2010), including WPB in the Sierra Nevada (Robbins et al., 2022). The effect of warming on beetle populations suggests outbreaks may become more severe under global warming. Conversely, warming may create phenological asynchronies, which reduce the efficacy of attacking beetles (Lombardo et al., 2018). Changes in temperature and precipitation may also affect the growth, distribution, and abundance of hosts, competitors, and symbionts resulting in changes that facilitate or dampen future bark beetle outbreaks (Williams and Liebhold, 2002; Bentz et al., 2010). Through killing hosts, bark beetles alter forest structure and composition and may limit subsequent outbreaks until adequate host densities have recovered (Raffa et al., 2013; Hart et al., 2015; Foster et al., 2018). Generally, outbreaks cease when beetle populations collapse due to either cold winter temperatures, a lack of suitable hosts, or increased populations of natural enemies (Wermelinger, 2002; Sambaraju et al., 2012).
Accurate forecasts of C balances need to account for bark beetle-induced tree mortality and the influence of climate on both populations of bark beetles and the defenses of host trees (Anderegg et al., 2015; Bentz and Jӧnssson, 2015). To project the future forest conditions under which outbreaks could occur, we simulated forest dynamics using phenological models of WPB coupled with a model of tree defense for PIPO under various climate scenarios. This model (Robbins et al., 2022) forecasts annual and decadal responses of WPB populations to climate and the effect of climate on the likelihood of outbreak occurrence. It also captures how tree stress and WPB populations influence the likelihood of a successful attack by WPB on a host tree. Our objectives were to understand the likelihood of future WPB outbreaks and how forest stand conditions, drought, and temperature contribute to outbreaks. We hypothesize that: 1) live C in PIPO would not return to 2012 (pre-drought) levels owing to increased future WPB outbreaks, 2) climate scenarios with frequent severe droughts will foster WPB outbreaks until there are no longer sufficient populations of PIPO to maintain outbreaks, and 3) higher emissions scenarios (Representative Concentration Pathway, RCP 8.5) would result in higher levels of PIPO mortality due to the benefits that warmer temperatures confer to WPB populations (Miller and Keen, 1960; Robbins et al., 2022).
2 Materials and methods
2.1 Study area
Our study area is the central and southern Sierra Nevada of California, encompassing the Eldorado, Stanislaus, Sierra, and Sequoia National Forests and Kings Canyon, Sequoia, and Yosemite National Parks (Figure 1). The elevational range (400–2,200 m) was determined by the 5th to 95th percentile of the host PIPO range as estimated from the USDA Forest Service Forest Inventory and Analysis Program (FIA, Bechtold and Patterson, 2015). For reference, historically, the Stanislaus-Tuolumne Experimental Forest (located near the center of our study area, at 590–1950 m elevation) receives, on average, 940 mm of precipitation, with more than half falling as snow in winter (Adams et al., 2004). Summer (June-September) is generally an extended dry period with air temperatures that range from 6°–27°C. Winters are cool and wet with air temperatures that range from −7°C–7°C.
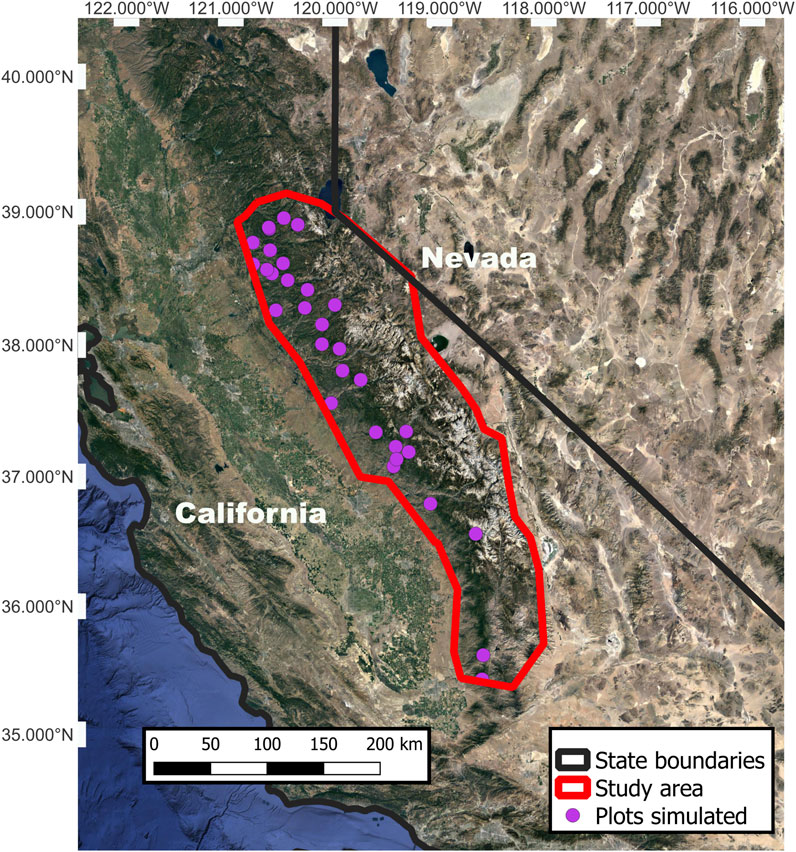
FIGURE 1. The study area in the Sierra Nevada, California, U.S. Plots simulated to represent the approximate location of the USDA Forest Service Forest Inventory and Analysis plots used in our simulations. Included for context are portions of state boundaries between California and Nevada.
We selected 31 sites to simulate, representing plots measured by FIA during 2005–2006 that contained >10% PIPO by basal area (m2 ha-1; BA). On these 0.4-ha plots, FIA field technicians recorded each tree’s diameter and species, whether it is alive or dead, and the cause of mortality. The same plots are censused every ten years and are sampled in a manner that allows scaling to per hectare measurements. The most common tree species, measured by basal area, were PIPO, sugar pine (Pinus lambertiana), incense cedar (Calocedrus decurrens), canyon live oak (Quercus chrysolepis), Douglas fir (Pseudotsuga menziesii), California black oak (Quercus kellogii), and white fir (Abies concolor). We estimated initial tree densities for each site using FIA data from the 2005–2006 measurement and binned species into eight size cohorts (by diameter at breast height; cm: dbh) to calculate initial tree density.
2.2 Model structure
To simulate forests and WPB dynamics at each site, we used the insect mortality and phenology model (IMAP, Goodsman et al., 2018) combined with the tree defense and insect attack models (IMAP-TDIA, Robbins et al., 2022) coupled with statistical models for tree growth, regeneration, and background mortality. As an overview of the model structure, for a given year, the statistical models simulated annual growth and background mortality for each tree cohort and regeneration for all tree species at a given site. Then the IMAP-TDIA model (which simulates the sub-daily response of WPB to temperature) was run to account for WPB population change and WPB-induced PIPO mortality on that site for that given year. The model updated PIPO mortality for each site. Each population of WPB and trees was then carried over to the next annual step. This combined model produced the BA, dbh, density of each cohort, and WPB population levels from IMAP-TDIA, which we used in the analysis.
To account for the growth, regeneration, and background mortality rates of the simulated tree species, we fit statistical models to data from FIA (Bechtold and Patterson, 2015). We selected 1,233 plots in the study area that had two censuses between 2000 and 2018 (Figure 1). Plots are censused once every ten years. Using the observed change between censuses, we analyzed these plots to determine the mean annual increment (change in diameter at breast height in cm; Δdbh) for each tree, the mortality rate for each of the nine age classes across plots, and the total amount of new regeneration in each plot. Each species’ total BA was calculated for each plot, as well as the total plot BA. PIPO trees killed by either insects or drought were removed from the analysis of mortality as they would be captured in the IMAP parameterization and thus not included in background mortality. To fit each species-specific growth model, Δdbh was fit to a linear model based on the previous size of the tree, the total BA within the stand, and the elevation at which the tree was growing (Supplementary Figures S1–S6). This representation captures the size-relative growth rates, the pressure on growth associated with competition, and the distribution across the elevation gradient of each tree species. To fit the species-specific regeneration model, the number of regenerating trees was fit to a generalized linear model with a Poisson distribution in which lambda (the parameter for the mean number of regeneration events per site) is a function of the total plot BA to capture the negative effect of competition and the parental species plot BA assuming a positive association with parental seed source (Supplementary Figure S7). We estimated background mortality as the mean value across plots for each tree species and tree size class (Supplementary Figure S8). While this does not capture all of the complexity of future competition, it provides a baseline of species competition (which affects susceptibility to WPB) by controlling host density. The insect mortality and phenology model, coupled with the tree defense and insect attack model (IMAP-TDIA), simulates the life cycle, mortality, flight, tree host defense, and attack efficiency of WPB. The IMAP portion of the model uses an integral projection to simulate the growth of WPB through the various stages of WPB development (egg, larva, pupa, teneral adult, and adult). It additionally captures crucial demographic processes (oviposition rates, flight initiation, stage, and temperature-specific mortality of WPB). The TDIA model simulates the success of WPB attacks based on tree demographics, WPB flight population, and drought (as measured by the 4-year standard precipitation index; SPI-4 years). Robbins et al. (2022) provide more detailed information on the parameterization of the IMAP-TDIA for WPB.
2.3 Model modifications
To account for changes in the host density, we made a key modification to the IMAP-TDIA, specifically to add tree density as a predictive factor for tree defense (Eq. 4). For context, within the IMAP-TDIA, WPB attack success is calculated based on the number of successful attacks per PIPO in size class t as,
where k is the aggregation efficiency of WPB, b is the density of WPBs in flight (WPB ha-1) attracted to a given PIPO size class and
where
As
where
Increased tree stand density (basal area) reduces resource availability and therefore lowers the defense capabilities of the host to defend itself against WPB and is an additional variable predictive of tree mortality (Fettig et al., 2019). Therefore, in this calibration, we amended the TDIA mortality model to account for plot level BA in the calculation of
where D is the plot BA (inclusive of all species).
The TDIA model was then re-parameterized using a Markov chain Monte Carlo optimization to capture the effect of the total plot BA described in Robbins et al. (2022), using regional data on WPB mortality (2006–2018, Supplementary Table S1, S2). Data for initial stand BA was calculated from FIA. The plot level BA was continually updated during parameterization in response to PIPO mortality. Overall IMAP-TDIA captured 94% of the variability in the PIPO population at each time step and 72% of the variability in the amount of PIPO killed at each time step (2006–2018, Supplementary Figure S9). IMAP-TDIA additionally captured the general temporal trend of outbreak occurrence (2006–2018, Supplementary Figure S10).
2.4 Hypothesis testing
Climate data used in simulations for each site were obtained from a combination of observational data and statistically downscaled Coupled Model Intercomparison Project version 5 (CMIP5; Taylor et al., 2012) model outputs. For the observational period (2006–2018), we used the gridded observational dataset Daymet (Thornton et al., 2012). For future projections (2018–2100), downscaled output for 18 CMIP5 models using the Multivariate Adaptive Constructed Analogs (MACA) method (Abatzoglou and Brown, 2012) (Supplementary Table S3; Figure 1) was used for both the intermediate greenhouse emissions scenario (RCP 4.5, peak in CO2 equivalent concentration around 2040, with a value of ∼550 ppm by 2100) and the high greenhouse emissions scenario (RCP 8.5, CO2 concentration continues to increase, with a value of ∼1,250 ppm by 2100). We used the minimum and maximum daily temperature and SPI-4 years in the simulations. SPI-4 years (McKee et al., 1993) was selected due it is predictive capacity for Sierra Nevada tree mortality and insect outbreak (Madakumbura et al., 2020; Robbins et al., 2022). SPI-4 years was calculated using data from each site from 1995 to 2005. Robbins et al. (2022) found that an SPI-4 years was the most predictive climate model for explaining mortality caused by WPB (R2 = 0.42). For each site, we used the combined IMAP-TDIA and vegetation model and observed Daymet historical climate data from 2006–2018 (used in Robbins et al., 2022) to reconstruct the 2012–2015 drought and WPB outbreak and its effect on stand structure. MACA climate data from 2018–2100 were then used to simulate the response to future climate change (Figure 2). Simulations were analyzed for the change in each tree species’ BA over time. C storage was calculated via the above-ground biomass using separate equations for stem and branch biomass from Jenkins et al. (2003). Equations were selected that had the highest reported R2. It was assumed that 50% of biomass was C. To understand the individual risk to stands of WPB outbreaks on an annual basis, we fit two quasi-binomial models for the predictor variables of total stand BA, annual mean temperature, and SPI-4 years. The first quasi-binomial model was fit to the probable percentage of PIPO mortality (by BA) and the second to the loss of live C associated with PIPO mortality.
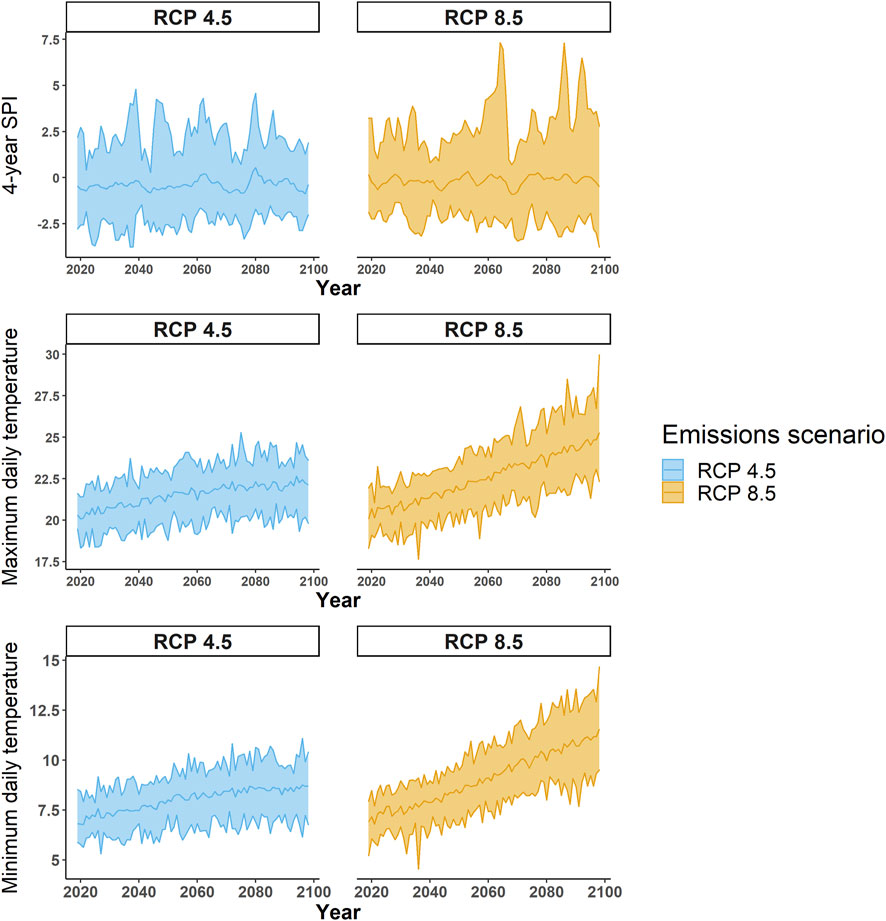
FIGURE 2. Projected minimum 4-year standard precipitation index, mean annual daily maximum temperature, and mean annual daily minimum temperature under RCP 4.5 and RCP 8.5. The trendline represents the model ensemble means, while the ribbon represents the model range.
3 Results
3.1 Demography
The total BA of PIPO did not recover to 2012 levels by 2100. Under RCP 8.5, there were a period of ∼3 decades of slight (∼3 m2 ha-1) PIPO BA recovery before declining to levels comparable to 2012 (Figure 3). The proportion of incense cedar, white fir, Douglas fir, and sugar pine are all projected to increase (Figure 3). However, PIPO remained the dominant tree species under both emissions scenarios (Figure 3). The recovery in host BA needed to trigger WPB outbreaks of a severity similar to that seen between 2012–2016 is not reached prior to 2075. However, smaller WPB outbreaks did occur when drought levels were similar to those observed in 2015 (SPI-4 years ∼−2.5). For example, under the CCSM RCP 4.5 climate scenario, regular outbreaks of decreasing severity are projected to occur until 2050, when the climate model projects less frequent droughts. The initial loss of live C during the 2012–2015 drought is due to reduced mean tree C and stem density. While mean tree C increases during the period (2020–2100) following the outbreak, the stem density declines or remains steady (Figure 4). While it is normal for stem density to fall over time, the lack of an increase following the outbreak and the relative increase in competing species (Figure 3) may suggest poor regeneration and competition in PIPO.
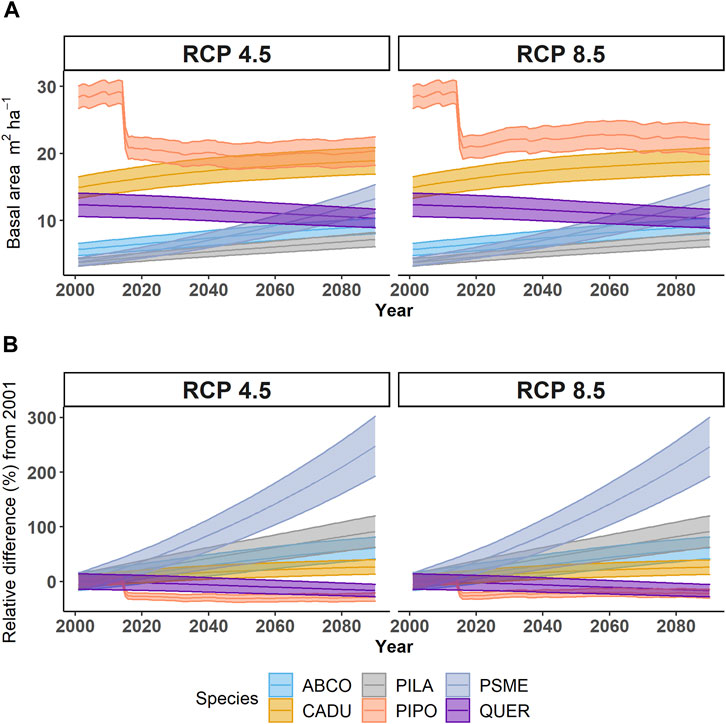
FIGURE 3. (A) Mean species landscape basal area (m2 ha-1) and (B) relative change in landscape basal area (m2 ha-1) by tree species under two emissions scenarios (RCP 4.5, RCP 8.5). Ribbons represent the 95% CI of all models under each scenario. Species abbreviations are ABCO, Abies concolor; CADU, Calocedrus decurrens; PILA, Pinus lambertiana; PIPO, Pinus ponderosa; PSME, Pseudotsuga menziesii; QUER, Quercus chrysolepis, and Quercus kelloggii.
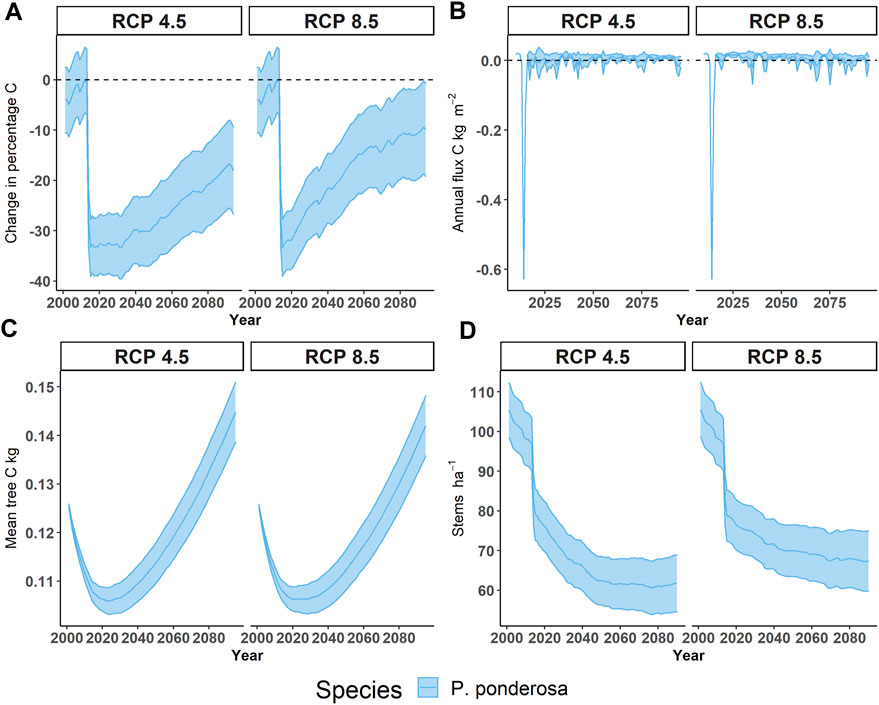
FIGURE 4. Changes in live ponderosa pine (Pinus ponderosa) under two emissions scenarios. (A) Changes in live carbon as a percentage of live carbon in ponderosa pine compared to 2012, (B) Annual flux of live carbon (kg m-2), (C) Mean per tree carbon (kg), and (D) stem density (ha-1). Note that this represents the average of each emissions scenario across all 18 climate models. Ribbons represent 95% confidence intervals. Model runs and stand structures provide estimates of storage in 2012.
3.2 Future carbon fluxes
On average, for the 18 GCMs under both emissions scenarios (RCP 4.5 and 8.5), the amount of live C in PIPO did not return to 2012 levels by 2100 (Figure 4). Within simulated stands, pre-drought C stored in PIPO was ∼2.30 kg C m-2. Following the 2012–2015 drought, C stored in PIPO was ∼1.55 kg C m-2, a loss of ∼0.75 kg C m-2. The model with the most C stored by the end of the century (CNRM-CM5) was at 2.9 kg C m-2 and occurred in model runs with almost no PIPO mortality attributed to WPB, while the mean recovery across models was 1.98 kg C m-2 (95% CI: 1.74–2.21 kg C m-2). The model with the least amount of C stored by the end of the simulation (CCSM RCP 4.5) only held 0.3 kg C m-2. These results affirm our first hypothesis. However, a greater amount of C accumulation was projected under RCP 8.5 than RCP 4.5 (Figure 4). The mean trend line of a slow recovery in both emissions scenarios, however, masks the divergent futures of WPB outbreaks presented by individual climate scenarios (Figure 5). The frequency of outbreaks appears related to the frequency of droughts < −2.5 SPI-4 years (Figure 5), and live C in PIPO failed to recover to 2012 levels in 19 of 36 model runs. There was no clear pattern regarding the emissions scenario and the likelihood of restoring live C (7 of the models that did recover are RCP 8.5, and 9 are RCP 4.5), indicating our first hypothesis is contingent on climate model assumptions, particularly regarding the likelihood of more severe droughts (SPI-4 years < −2.5). In several models, reaching a landscape mean of ∼3 kg m-2 C led to another severe WPB outbreak (see Figure 4, CSIRO-Mk3-6-0 RCP 8.5 and HadGEM2-CC365 RCP 8.5). In the HadGEM2-cc365 scenarios in ∼2075, an WPB outbreak of similar severity to that associated with the 2012–2015 drought occurred following C recovery to near 2012 levels. The GFDL-ESM2G RCP 4.5 and GFDL-ESM2M RCP 8.5 climate scenarios projected frequent small WPB outbreaks throughout the century, which kept average landscape PIPO BA to ∼20 m2 ha-1 or 1 kg m-2 C. These models are characterized by their high variance in the SPI-4 years and have many years in which SPI-4 years < −2. Even under climate models with frequent WPB outbreaks, each successive drought had less PIPO mortality, suggesting that low stand density limits outbreak size (Figure 5).
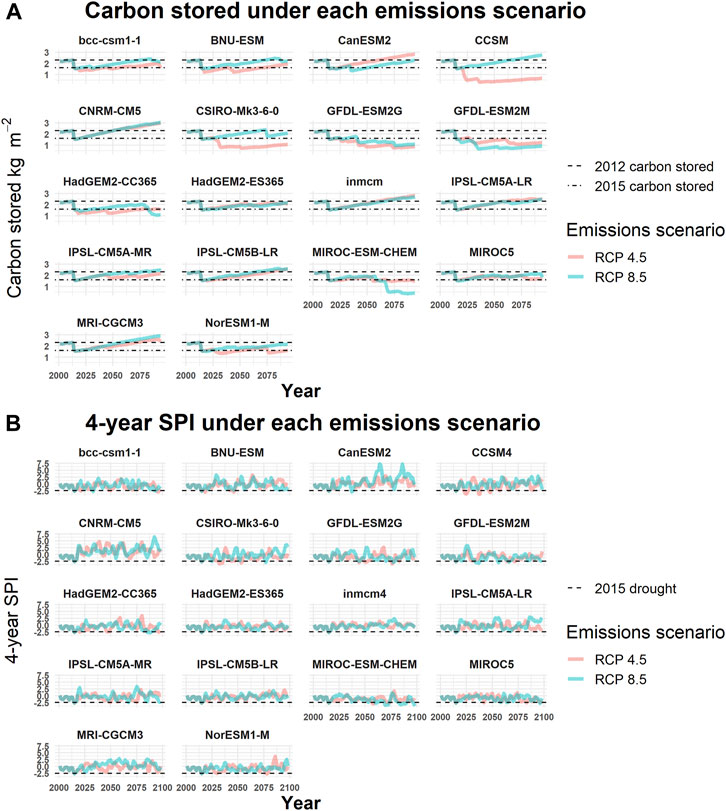
FIGURE 5. Climate model and emissions simulations, 2000–2100: (A) Mean ponderosa pine (Pinus ponderosa) live carbon stored and (B) projected 4-year standard precipitation index (SPI). The line color (RCP 4.5 is red, and RCP 8.5 is blue) represents emissions scenarios. The dotted lines represent live carbon stored in 2012 and 2015 for reference. The model of origin is the header of each panel.
3.3 Likelihood of future mortality and carbon loss
In estimating the annual percentage of PIPO mortality in each stand from predictors of annual mean temperature, annual minimum SPI-4 years, and total plot BA, we found a quasi-binomial generalized linear model to be significant for each variable (Table 1, p < 0.05). Overall, this model had a D2 = 0.455 (Residual deviance divided by null deviance; Guisan and Zimmermann, 2000). Additionally, we found these variables to be significant predictors of loss of live C (Table 2, p < 0.05). ANOVA also suggests that total plot BA (F = 6,576, p < 2e-16) was the most predictive variable in determining percent PIPO mortality, followed closely by annual minimum SPI-4 years (F = 5,089, p < 2e-16) and then annual mean temperature (F = 788, p < 2e-16). While drought determines the frequency of WPB outbreaks, BA at the site level plays a major role in regulating the severity of WPB outbreaks (Figure 6). For example, even a minor annual drought (SPI-4 years = −1) can trigger substantial (>10%) tree mortality at a stand BA of 100 m2 ha-1 (Figure 6). However, at a stand BA of 60 m2 ha-1, >10% mortality would likely require a severe drought (SPI-4 years < −2.0) and at 20 m2 ha-1 BA >10% mortality is unlikely under less than the most extreme droughts (SPI-4 years < −2.5). Warmer mean annual temperatures (16°C, those expected near the end of the century under RCP 8.5) generally decreased the expected percent of PIPO mortality slightly (Figure 6). Live C killed yr-1 showed an even greater effect for site-level tree density. C-dense sites (>10 kg m-2) were far more likely to experience mortality under drought conditions (SPI-4 years < −2.0), with as much as 25% of live C removed in a single year. Low C storage sites (3.3 kg m-2) under a similar condition would likely lose only ∼5% of live C. Warmer temperatures increase the likelihood of live C loss under all stocking levels.
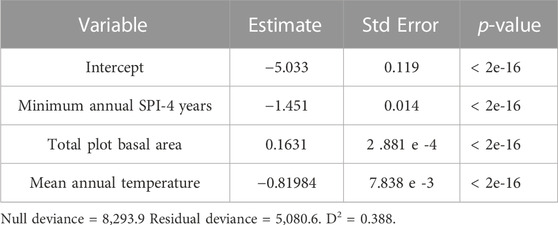
TABLE 1. Generalized linear quasi-binomial model fit to predict percent ponderosa pine (Pinus ponderosa) mortality annually.
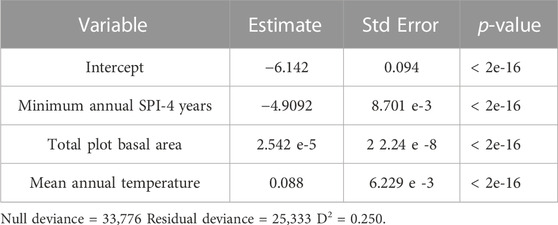
TABLE 2. Generalized linear quasi-binomial model fit to predict live carbon loss in ponderosa pine (Pinus ponderosa) annually.
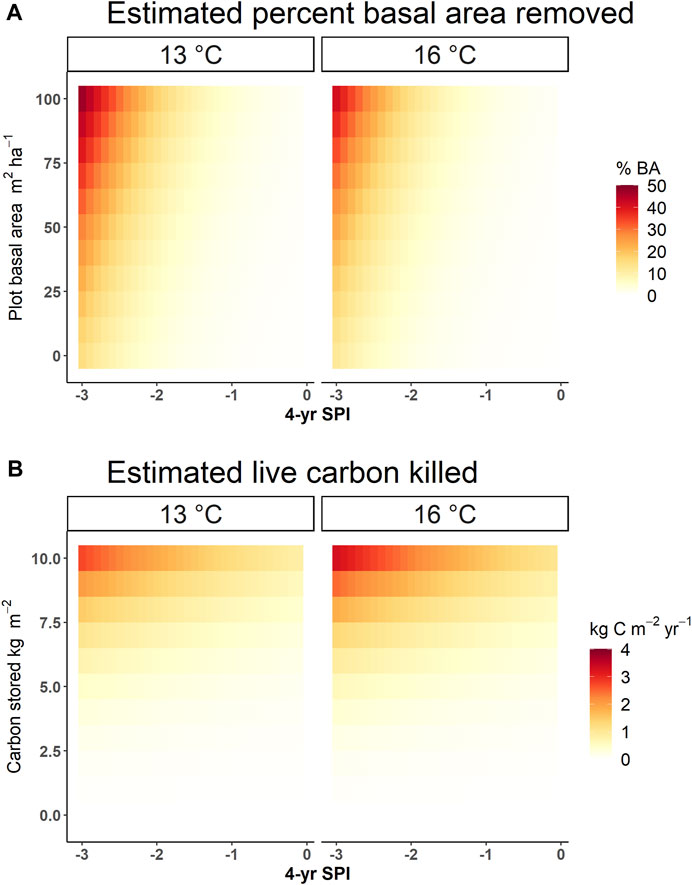
FIGURE 6. Heat map of basal area and live carbon killed probabilities based on 4-year standard precipitation index (4-year SPI) and plot status. (A) the percent of ponderosa pine (Pinus ponderosa; PIPO) basal area killed on average at a given initial plot basal area (m2 ha-1) and 4-year SPI; (B). Ribbons represent the 95% CI of all models under each scenario. The estimate of live carbon killed (kg m-2 yr-1) is based on the amount of carbon stored in a stand the year prior and the SPI-4 years. Each estimate averages across various plots and only for a single year. Models estimated from the simulation run on both emissions scenarios for all 18 climate models.
4 Discussion
4.1 Future WPB outbreaks and carbon loss
Major efforts are underway to better understand the effects of disturbances on C sequestration and storage capacities in U.S. forests. For example, Quirion et al. (2021) used remeasurement data from national FIA plots and found those plots recently impacted by forest insects sequestered ∼69% less C in trees than plots with no recent disturbance. Nationally, they estimated that C sequestration is reduced by ∼9.3 Tg C yr-1 in forests that have experienced insect disturbance. Our results show that under both emissions scenarios, it is unlikely that the 30% live C loss in PIPO following the 2012–2015 drought will be regained by 2100 due to future incidences of WPB outbreaks (Figure 4). This echoes results found by Bernal et al. (2022), that future live C stocks will be much lower than those of the last few decades (in their instance owing to fire), and that under changing climate the long-term C sequestration capability of these forests must be reassessed. Future mega-droughts on a similar scale to that of the 2012–2015 drought (<−2.5 SPI-4 years) were seen in many climate models, leading to high levels of mortality and C loss. Drought was the biggest indicator of both mortality and C loss. However, the future projections diverge in their likelihood of future drought. Overall, we see little obvious pattern between emissions scenarios; however, we see a wide range of variance among climate models. The likelihood of droughts with an SPI-4 years < −2 ranges from almost decadal (see CCSM RCP 4.5 or MIROC5 RCP 4.5; Figure 4) to none during the remainder of this century (see CAN ESM2 RCP_4.5). This results in a range of outcomes varying from recovering to the pre-drought C levels (landscape average of ∼2.4 kg m-2) around the year 2060 (see CNRM-CM5) to even further live C losses (< 1 kg m-2) due to frequent droughts and WPB outbreaks (see GFDEL-ESM2G).
Our study provides additional evidence that the high levels of PIPO mortality associated with the 2012–2015 drought were likely the confluence of high overall tree density, an abundance of ideal bark beetle hosts, warm temperatures, and intense episodic drought (Fettig et al., 2019). Limited precipitation and heightened evapotranspiration reduced accessible soil water leading to increased host stress and susceptibility to bark beetle attack (Goulden and Bales, 2019) by several bark beetle species, but most notably WPB (Fettig et al., 2019). Lastly, contemporary warming accelerated WPB development and temperatures were never sufficiently cold enough to result in levels of overwintering mortality sufficient to curb the outbreak (Miller and Keen, 1960; Robbins et al., 2022). While WPB outbreaks will continue to occur in the Sierra Nevada, most are likely to be of lower severity than those associated with the 2012–2015 drought as PIPO is unlikely to regain densities (by BA) observed prior to the drought. Crucially, this suggests the loss of host BA limits subsequent WPB outbreaks in the Sierra Nevada, even under rising temperatures and future drought conditions. In considering our second hypothesis, the projected drought did not increase WPB outbreaks to a severity or frequency sufficient to cease the occurrence of future WPB outbreaks due to insufficient hosts. Intuitively, this makes sense as WPB exhibits a strong preference for larger-diameter (>50 cm dbh) PIPO, with seedlings and saplings being unaffected (Fettig, 2016). However, WPB outbreaks did limit the severity of successive outbreaks even under future droughts of similar severity to the 2012–2015 drought (Figure 5). This illustrates the effect hosts have in limiting outbreak severity, a point further supported by our models (Figure 6). Strong negative feedback in host loss has been found in other bark beetle systems, where the loss of large-diameter hosts even 60 years prior may prevent future outbreaks under drought (e.g., Hart et al., 2015; Foster et al., 2018). This is an example of long-term ecological memory of these forests, as one disturbance event may confer resilience against future disturbance events (Johnston et al., 2016). A similar relationship exists for wildfires where previous fires have been demonstrated to limit the severity of future fires (e.g., Parks et al., 2014; Parks et al., 2016) and mountain pine beetle (Dendroctonus ponderosae) outbreaks (Jentsch et al., 2021). While not considered in our simulations, surviving PIPO may also have unique traits (e.g., high growth rates) and genetically confer resistance to younger PIPO, additionally limiting future WPB outbreaks (Keen et al., 2020). It is important to consider however, that this does not mean areas that still have high host populations (or where mortality was low) are not susceptible to future outbreaks.
4.2 Climate scenarios
Our analysis of climate scenarios shows a stronger difference in the frequency of future droughts among models rather than between emissions scenarios. The frequency and severity of future WPB outbreaks were less associated with a given emissions scenario and more associated with trends in future precipitation (i.e., drought frequency). Emissions scenarios alone, therefore, may not be the optimal way to consider future patterns and impacts of bark beetle outbreaks, given the uncertainty associated with projected changes in precipitation. Rather future studies might consider a typology of drought that could be used to understand the range of possible outcomes. Under the more recent CMIP-6 model ensemble, Madakumbura et al. (2020) concluded that droughts with SPI-4 years values similar to those of the 2012–2015 drought were more likely to occur in the future.
4.3 Forest density
Vegetative expansion (largely due to the suppression of wildfire) in the Sierra Nevada prior to the 2012–2015 drought created denser forest conditions that exacerbate the climatic stress experienced by trees (Dolanc et al., 2014; McIntyre et al., 2015) and an abundance of medium to large-sized PIPO provided adequate hosts for the WPB outbreak (Restanino et al., 2019). Our results show that future climate will likely influence the level of forest density, and therefore forest resistance to drought, as scenarios with much more frequent, severe droughts maintain less total C (Figure 5). This suggests that the tree mortality event associated with the 2012–2015 drought may initiate a new equilibrium regarding total basal area and C sequestered under a changing climate in portions of the Sierra Nevada as PIPO is not likely to recover to 2012 levels by 2100 (Figure 3; Figure 4). However, our simulations of climate scenarios with less frequent drought were more likely to regain prior live C levels, at which time they became susceptible to another severe WPB outbreak (Figure 5).
While our results indicate that changes in climate may increase the frequency of future WPB outbreaks, they also provide evidence that management directed toward limiting tree densities provides more stable and resilient forests (North et al., 2022). Furthermore, our results support recent evidence that forest densification amplified levels of tree mortality associated with the 2012–2015 drought (Fettig et al., 2019; Furniss et al., 2021). Wildfire suppression is perceived to be the primary driving force of forest densification across the Sierra Nevada and restoring fire to this landscape at meaningful scales will help mitigate future tree losses overall (Dolanc et al., 2014; North et al., 2022). For example, stands that were treated to reduce tree density (multiple mechanical and/or prescribed burns intended to increase stand resilience and health at a minimum of 4 ha) had significantly lower mortality rates after the 2012–2015 drought (Restanino et al., 2019). Similarly, Knapp et al. (2021) demonstrated that on the Stanislaus-Tuolumne Experimental Forest thinning reduced the overall tree mortality rate between 2014–2018 from 34% to 11%. Importantly, our results suggest that this type of treatment may be effective even in future climates.
4.4 Warming’s effect on WPB outbreaks
Our third hypothesis was that the higher emissions scenario (generally with higher temperatures) would lead to increasingly severe WPB outbreaks. While temperatures increased more rapidly under RCP 8.5 (Supplementary Figures S11, S12), we observed little increase in the severity of WPB outbreaks (% BA, Figure 6A). Our results show a smaller effect from warming than Robbins et al. (2022), who reported that contemporary warming increased WPB’s development rate and decreased WPB’s overwintering mortality rate, leading to increased WPB population growth during periods of lowered tree defenses. In short, they attributed ∼30% of the increase in PIPO mortality associated with the 2012–2015 drought to the direct effects of warming on WPB. However, the WPB outbreak associated with the 2012–2015 drought occurred during a period with much higher host densities. Therefore, the effects of elevated temperature on WPB outbreak success may require that the other two drivers of the outbreak (drought and host density) be present to a sufficient degree. The increasing temperature did, however, result in a higher loss of live C yr-1 on average. Higher temperatures that benefit WPB populations may result in the ability to attack larger trees successfully. However, the ultimate mortality and WPB reproduction rate also depend on PIPO demographics, stand structure, and tree stress. While we hypothesized (and it is biologically feasible) that rising temperatures may eventually prove deleterious to WPB populations, our simulations did not support this hypothesis. Our model simulates the decline in WPB flight that occurs with increasing temperatures and its cessation at high temperatures (38.9°C), and the decline in WPB development that occur under high temperatures (Robbins et al., 2022). This lack of deleterious effect is likely due to the relatively mild climate of our study area. Even under the warmest climate scenario (MICRO-ESM-CHEM RCP 8.5), only 0.6% of days (∼2 d yr-1) exceed the maximum temperatures conducive to WPB flight. In the 2090s, under MICRO-ESM-CHEM RCP 8.5, this increases to only 2% of days (∼7 d yr-1), which is likely insufficient to affect WPB population dynamics. The increase in daily maximum temperature appears insufficient to place a thermal limit on WPB in the Sierra Nevada of California.
4.5 Limitations and future research
We made several simplifications that limit the applicability of our results. First, the empirical nature of our vegetation dynamics (growth, regeneration, and other mortality) limits our ability to quantify the competitive dynamics of future Sierra Nevada forests under changing climate conditions (higher CO2 levels, warmer temperatures and reductions in precipitation). We could only account for some of the effects of climate on WPB and tree defense, but not others affecting vegetation. Crucial to our findings, we assumed adequate PIPO regeneration, which may be increasingly at risk under a changing climate (Petrie et al., 2017). Relatedly, Fettig et al. (2019) reported that tree regeneration following the 2012–2015 drought was dominated by incense cedar and Quercus spp. in areas of heavy tree mortality. Second, our model only simulated a single bark beetle disturbance (WPB) which in the Sierra Nevada only directly affects a single tree species (PIPO). Crucially, several tree species suffered elevated levels of mortality attributed to colonization by several species of bark beetles during and after the 2012–2015 drought (Fettig et al., 2019). We also only simulated a single disturbance, while forests of the Sierra Nevada face multiple disturbances (Scheller, 2018) and interactions among them (e.g., Stephens et al., 2018). Of note, PIPO is a fire-adapted species, and the absence of fire may limit its competitive advantage in the future (Larson et al., 2013). Future work to simulate the IMAP-TDIA simulation into a dynamic vegetation and disturbance model that could more mechanistically capture the vegetation’s response to climate and test multiple disturbances would improve our projections (Koven et al., 2020; Buotte et al., 2021; Scheller et al., 2007). Finally, given the length of the simulation (2006–2100), it is possible that the initial parameterization of beetle attack and tree defense mechanisms may change as trees become adapted to drier and warmer climates. Changes in tree defense over time could allow PIPO greater defense and limit the likelihood of future outbreaks (Keen et al., 2020).
Interaction among WPB populations and forests of the Sierra Nevada have the potential to change under climate change. We conclude that outbreaks of WPB are incited by drought incidence (measured by SPI-4 years) but that the severity of outbreaks is driven by host density. In many areas, the latter can be regulated by mechanical thinning, prescribed fire, and/or managed wildfire (i.e., wildfires that are allowed to burn under appropriate weather conditions). We conclude that WPB outbreaks of the severity and spatial extent observed in association with the 2012–2015 drought are unlikely within the study area in the near future, yet smaller outbreaks will prevent PIPO BA or C recovery to 2012 levels.
Data availability statement
The datasets presented in this study can be found in online repositories. The names of the repository/repositories and accession number(s) can be found below: https://github.com/lanl/IMAP-TDIA_CodeBase.
Author contributions
ZR, CX, CF, BA LK, RC-T, LK, and RS designed the study and the model. ZR conducted data assimilation, model runs, and data analysis. All authors interpreted the results, provided study redesigns, and wrote the manuscript.
Funding
This work was supported by the Laboratory Directed Research and Development Program of Los Alamos National Laboratory under project number 20210689ECR. CX acknowledges the support from UC National Laboratory Fees Research Program (LA-UR-20-30376) and Los Alamos National Laboratory Directed Research Program (20210062DR). LMK acknowledges the funding provided by the California Department of Forestry and Fire Protection as part of the California Climate Investments Program.
Acknowledgments
We would like to acknowledge Devin Goodsman, Jim Powell, Polly Buotte, Charles Koven, Gavin Madakumbura, Michael Goulden, and Alexander Hall, who contributed to initial model development. We additionally would like to thank the reviewers for improving the manuscript.
Conflict of interest
The authors declare that the research was conducted in the absence of any commercial or financial relationships that could be construed as a potential conflict of interest.
Publisher’s note
All claims expressed in this article are solely those of the authors and do not necessarily represent those of their affiliated organizations, or those of the publisher, the editors and the reviewers. Any product that may be evaluated in this article, or claim that may be made by its manufacturer, is not guaranteed or endorsed by the publisher.
Supplementary material
The Supplementary Material for this article can be found online at: https://www.frontiersin.org/articles/10.3389/fenvs.2023.1112756/full#supplementary-material
References
Abatzoglou, J. T., and Brown, T. J. (2012). A comparison of statistical downscaling methods suited for wildfire applications. Int. J. Climatol. 32 (5), 772–780. doi:10.1002/joc.2312
Adams, M. B., Loughry, L., and Plaugher, L. (2004). Experimental forests and ranges of the USDA Forest Service. NE-GTR-321 Revised. U.S. Department of Agriculture, Forest Service, Northeastern Research Station.
Anderegg, W. R. L., Hicke, J. A., Fisher, R. A., Allen, C. D., Aukema, J., Bentz, B., et al. (2015). Tree mortality from drought, insects, and their interactions in a changing climate. New Phytol. 208 (3), 674–683. doi:10.1111/nph.13477
Bechtold, W. A., and Patterson, P. L. (2015). The enhanced forest inventory and analysis Program national sampling design and estimation procedures. SRS-GTR-80. U.S. Department of Agriculture, Forest Service, Southern Research Station. doi:10.2737/SRS-GTR-80
Bentz, B. J., and Jönsson, A. M. (2015). “Modeling bark beetle responses to climate change,” in Bark beetles (London: Academic Press), 533–553. doi:10.1016/B978-0-12-417156-5.00013-7
Bentz, B. J., Régnière, J., Fettig, C. J., Hansen, E. M., Hayes, J. L., Hicke, J. A., et al. (2010). Climate change and bark beetles of the western United States and Canada: Direct and indirect effects. BioScience 60 (8), 602–613. doi:10.1525/bio.2010.60.8.6
Bernal, A. A., Stephens, S. L., Collins, B. M., and Battles, J. J. (2022). Biomass stocks in California’s fire-prone forests: Mismatch in ecology and policy. Environ. Res. Lett. 17 (4), 044047. doi:10.1088/1748-9326/ac576a
Buluç, L., Fischer, C., Ko, J., Balachowski, J., and Ostoja, S. (2017). “Drought and tree mortality in the Pacific Southwest Region,” in A synopsis of presentations and work group sessions from the science and management symposium-Lessons Learned From Extreme Drought and Tree Mortality in the Sierra Nevada: How Can Past Events Inform Our Approach Forward (Sacramento California: U.S. Department of Agriculture, California Climate Hub).
Buotte, P. C., Koven, C. D., Xu, C., Shuman, J. K., Goulden, M. L., Levis, S., et al. (2021). Capturing functional strategies and compositional dynamics in vegetation demographic models. Biogeosciences 18 (14), 4473–4490. doi:10.5194/bg-18-4473-2021
Dolanc, C. R., Safford, H. D., Thorne, J. H., and Dobrowski, S. Z. (2014). Changing forest structure across the landscape of the Sierra Nevada, CA, USA, since the 1930s. Ecosphere 5 (8), art101–26. doi:10.1890/es14-00103.1
Domke, G. M., Walters, B. F., Nowak, D. J., Greenfield, E. J., Smith, J., Nichols, M. C., et al. (2022). Greenhouse gas emissions and removals from forest land, woodlands, and urban trees in the United States, 1990–2020 Resource Update FS–382. U.S. Department of Agriculture, Forest Service, Northern Research Station. doi:10.2737/FS-RU-382
Fettig, C. J. (2016). “Native bark beetles and wood borers in Mediterranean forests of California,” in Insects and diseases of mediterranean forest systems. Editors F. Lieutier, and T. D. Paine (Switzerland: Springer International Publishing), 499–528.
Fettig, C. J., Asaro, C., Nowak, J. T., Dodds, K. J., Gandhi, K. J. K., Moan, J. E., et al. (2022). Trends in bark beetle impacts in North America during a period (2000–2020) of rapid environmental change. J. For. 120, 693–713. doi:10.1093/jofore/fvac021
Fettig, C. J., Klepzig, K. D., Billings, R., Munson, A. S., Nebeker, T. E., Negron, J. F., et al. (2007). The effectiveness of vegetation management practices for prevention and control of bark beetle infestations in coniferous forests of the western and southern United States. For. Ecol. Manag. 238 (1-3), 24–53. doi:10.1016/j.foreco.2006.10.011
Fettig, C. J., Mortenson, L. A., Bulaon, B. M., and Foulk, P. B. (2019). Tree mortality following drought in the central and southern Sierra Nevada, California, U.S. For. Ecol. Manag. 432, 164–178. doi:10.1016/j.foreco.2018.09.006
Foster, A. C., Shuman, J. K., Shugart, H. H., and Negron, J. (2018). Modeling the interactive effects of spruce beetle infestation and climate on subalpine vegetation. Ecosphere 9 (10), e02437. doi:10.1002/ecs2.2437
Furniss, T. J., Das, A. J., Mantgemvan, P. J., Stephenson, N. L., and Lutz, J. A. (2021). Crowding, climate, and the case for social distancing among trees. Ecol. Appl. 32, e2507. doi:10.1002/eap.2507
Goodsman, D. W., Aukema, B. H., McDowell, N. G., Middleton, R. S., and Xu, C. (2018). Incorporating variability in simulations of seasonally forced phenology using integral projection models. Ecol. Evol. 8 (1), 162–175. doi:10.1002/ece3.3590
Goulden, M. L., and Bales, R. C. (2019). California forest die-off linked to multi-year deep soil drying in 2012–2015 drought. Nat. Geosci. 12 (8), 632–637. doi:10.1038/s41561-019-0388-5
Goulden, M. L., and Bales, R. C. (2014). Mountain runoff vulnerability to increased evapotranspiration with vegetation expansion. Proc. Natl. Acad. Sci. 111 (39), 14071–14075. doi:10.1073/pnas.1319316111
Guisan, A., and Zimmermann, N. E. (2000). Predictive habitat distribution models in ecology. Ecol. Model. 135 (2), 147–186. doi:10.1016/s0304-3800(00)00354-9
Hart, S. J., Veblen, T. T., Mietkiewicz, N., and Kulakowski, D. (2015). Negative feedbacks on bark beetle outbreaks: Widespread and severe spruce beetle infestation restricts subsequent infestation. PLOS ONE 10 (5), e0127975. doi:10.1371/journal.pone.0127975
Hicke, J. A., Allen, C. D., Desai, A. R., Dietze, M. C., Hall, R. J., Hogg, T., et al. (2012). Effects of biotic disturbances on forest carbon cycling in the United States and Canada. Glob. Change Biol. 18 (1), 7–34. doi:10.1111/j.1365-2486.2011.02543.x
Houghton, R. A., and Nassikas, A. A. (2018). Negative emissions from stopping deforestation and forest degradation, globally. Glob. Change Biol. 24 (1), 350–359. doi:10.1111/gcb.13876
Huang, J., Kautz, M., Trowbridge, A. M., Hammerbacher, A., Raffa, K. F., Adams, H. D., et al. (2020). Tree defence and bark beetles in a drying world: Carbon partitioning, functioning and modelling. New Phytol. 225 (1), 26–36. doi:10.1111/nph.16173
Hurteau, M. D., North, M. P., Koch, G. W., and Hungate, B. A. (2019). Managing for disturbance stabilizes forest carbon. Proc. Natl. Acad. Sci. 116 (21), 10193–10195. doi:10.1073/pnas.1905146116
Jenkins, J. C., Chojnacky, D. C., Heath, L. S., and Birdsey, R. A. (2003). National-scale biomass estimators for United States tree species. Forest Science 49 (1), 12–35.
Jentsch, P. C., Bauch, C. T., and Anand, M. (2021). Fire mitigates bark beetle outbreaks in serotinous forests. Theor. Ecol. 14, 611–621. doi:10.1007/s12080-021-00520-y
Johnstone, J. F., Allen, C. D., Franklin, J. F., Frelich, L. E., Harvey, B. J., Higuera, P. E., et al. (2016). Changing disturbance regimes, ecological memory, and forest resilience. Front. Ecol. Environ. 14 (7), 369–378. doi:10.1002/fee.1311
Keen, R. M., Voelker, S. L., Bentz, B. J., Wang, S. Y. S., and Ferrell, R. (2020). Stronger influence of growth rate than severity of drought stress on mortality of large ponderosa pines during the 2012–2015 California drought. Oecologia 194 (3), 359–370. doi:10.1007/s00442-020-04771-0
Knapp, E. E., Bernal, A., Kane, J. M., Fettig, C. J., and North, M. P. (2021). Variable thinning and prescribed fire influence tree mortality and growth during and after a severe drought. For. Ecol. Manag. 479, 118595. doi:10.1016/j.foreco.2020.118595
Kolb, T. E., Fettig, C. J., Ayres, M. P., Bentz, B. J., Hicke, J. A., Mathiasen, R., et al. (2016). Observed and anticipated impacts of drought on forest insects and diseases in the United States. For. Ecol. Manag. 380, 321–334. doi:10.1016/j.foreco.2016.04.051
Koven, C. D., Knox, R. G., Fisher, R. A., Chambers, J. Q., Christoffersen, B. O., Davies, S. J., et al. (2020). Benchmarking and parameter sensitivity of physiological and vegetation dynamics using the functionally assembled terrestrial ecosystem simulator (FATES) at Barro Colorado Island, Panama. Biogeosciences 17 (11), 3017–3044. doi:10.5194/bg-17-3017-2020
Larson, A. J., Belote, R. T., Cansler, C. A., Parks, S. A., and Dietz, M. S. (2013). Latent resilience in ponderosa pine forest: Effects of resumed frequent fire. Ecol. Appl. 23 (6), 1243–1249. doi:10.1890/13-0066.1
Lombardo, J. A., Weed, A. S., Aoki, C. F., Sullivan, B. T., and Ayres, M. P. (2018). Temperature affects phenological synchrony in a tree-killing bark beetle. Oecologia 188 (1), 117–127. doi:10.1007/s00442-018-4164-9
Madakumbura, G. D., Goulden, M. L., Hall, A., Fu, R., Moritz, M. A., Koven, C. D., et al. (2020). Recent California tree mortality portends future increase in drought-driven forest die-off. Environ. Res. Lett. 15 (12), 124040. doi:10.1088/1748-9326/abc719
McDowell, N. G., Beerling, D. J., Breshears, D. D., Fisher, R. A., Raffa, K. F., and Stitt, M. (2011). The interdependence of mechanisms underlying climate-driven vegetation mortality. Trends Ecol. Evol. 26 (10), 523–532. doi:10.1016/j.tree.2011.06.003
McIntyre, P. J., Thorne, J. H., Dolanc, C. R., Flint, A. L., Flint, L. E., Kelly, M., et al. (2015). Twentieth-century shifts in forest structure in California: Denser forests, smaller trees, and increased dominance of oaks. Proc. Natl. Acad. Sci. 112 (5), 1458–1463. doi:10.1073/pnas.1410186112
McKee, T. B., Doesken, N. J., and Kleist, J. (1993). “The relationship of drought frequency and duration to time scales,” in Proceedings of the 8th Conference on Applied Climatology 17 (22), 179–183.
McKinley, D. C., Ryan, M. G., Birdsey, R. A., Giardina, C. P., Harmon, M. E., Heath, L. S., et al. (2011). A synthesis of current knowledge on forests and carbon storage in the United States. Ecol. Appl. 21 (6), 1902–1924. doi:10.1890/10-0697.1
Miller, J. M., and Keen, F. P. (1960). Biology and control of the western pine beetle: A summary of the first 50 years of research: U. S. Department of Agriculture, Forest Service.
North, M. P., Tompkins, R. E., Bernal, A. A., Collins, B. M., Stephens, S. L., and York, R. A. (2022). Operational resilience in western US frequent-fire forests. For. Ecol. Manag. 507, 120004. doi:10.1016/j.foreco.2021.120004
Parks, S. A., Miller, C., Holsinger, L. M., Baggett, L. S., and Bird, B. J. (2016). Wildland fire limits subsequent fire occurrence. Int. J. Wildland Fire 25, 182–190. doi:10.1071/WF15107
Parks, S. A., Miller, C., Nelson, C. R., and Holden, Z. A. (2014). Previous fires moderate burn severity of subsequent wildland fires in two large western US wilderness areas. Ecosystems 17, 29–42. doi:10.1007/s10021-013-9704-x
Petrie, M. D., Bradford, J. B., Hubbard, R. M., Lauenroth, W. K., Andrews, C. M., and Schlaepfer, D. R. (2017). Climate change may restrict dryland forest regeneration in the 21st century. Ecology 98 (6), 1548–1559. doi:10.1002/ecy.1791
Quirion, B. R., Domke, G. M., Walters, B. F., Lovett, G. M., Fargione, J. E., Greenwood, L., et al. (2021). Insect and disease disturbances correlate with reduced carbon sequestration in forests of the contiguous United States. Front. For. Glob. Change 4, 716582. doi:10.3389/ffgc.2021.716582
Raffa, K. F., Aukema, B. H., Bentz, B. J., Carroll, A. L., Hicke, J. A., Turner, M. G., et al. (2008). Cross-scale drivers of natural disturbances prone to anthropogenic amplification: The dynamics of bark beetle eruptions. BioScience 58 (6), 501–517. doi:10.1641/b580607
Raffa, K. F., Powell, E. N., and Townsend, P. A. (2013). Temperature-driven range expansion of an irruptive insect heightened by weakly coevolved plant defenses. Proc. Natl. Acad. Sci. 110 (6), 2193–2198. doi:10.1073/pnas.1216666110
Restaino, C., Young, D. J. N., Estes, B., Gross, S., Wuenschel, A., Meyer, M., et al. (2019). Forest structure and climate mediate drought-induced tree mortality in forests of the Sierra Nevada, USA. Ecol. Appl. 29 (4), e01902. doi:10.1002/eap.1902
Robbins, Z. J., Xu, C., Aukema, B. H., Buotte, P. C., Chitra-Tarak, R., Fettig, C. J., et al. (2022). Warming increased bark beetle-induced tree mortality by 30% during an extreme drought in California. Glob. Change Biol. 28 (2), 509–523. doi:10.1111/gcb.15927
Sambaraju, K. R., Carroll, A. L., Zhu, J., Stahl, K., Moore, R. D., and Aukema, B. H. (2012). Climate change could alter the distribution of mountain pine beetle outbreaks in Western Canada. Ecography 3 (35), 211–223. doi:10.1111/j.1600-0587.2011.06847.x
Scheller, R. M. (2018). The challenges of forest modeling given climate change. Landsc. Ecol. 33 (9), 1481–1488. doi:10.1007/s10980-018-0689-x
Scheller, R. M., Domingo, J. B., Sturtevant, B. R., Williams, J. S., Rudy, A., Gustafson, E. J., et al. (2007). Design, development, and application of LANDIS-II, a spatial landscape simulation model with flexible temporal and spatial resolution. Ecol. Model. 201 (3–4), 409–419.
Serra-Diaz, J. M., Maxwell, C., Lucash, M. S., Scheller, R. M., Laflower, D. M., Miller, A. D., et al. (2018). Disequilibrium of fire-prone forests sets the stage for a rapid decline in conifer dominance during the 21st century. Sci. Rep. 8 (1), 1. doi:10.1038/s41598-018-24642-2
Sleeter, B. M., Marvin, D. C., Cameron, D. R., Selmants, P. C., Westerling, A. L., Kreitler, J., et al. (2019). Effects of 21st-century climate, land use, and disturbances on ecosystem carbon balance in California. Glob. Change Biol. 25 (10), 3334–3353. doi:10.1111/gcb.14677
Stephens, S. L., Collins, B. M., Fettig, C. J., Finney, M. A., Hoffman, C. E., Knapp, E. E., et al. (2018). Drought, tree mortality, and wildfire in forests adapted to frequent fire. Bioscience 68, 77–88. doi:10.1093/biosci/bix146
Stephenson, N. L., Das, A. J., Ampersee, N. J., Bulaon, B. M., and Yee, J. L. (2019). Which trees die during drought? The key role of insect host-tree selection. J. Ecol. 107 (5), 2383–2401. doi:10.1111/1365-2745.13176
Taylor, K. E., Stouffer, R. J., and Meehl, G. A. (2012). An overview of CMIP5 and the experiment design. Bull. Am. Meteorological Soc. 93 (4), 485–498. doi:10.1175/bams-d-11-00094.1
Thornton, P. E., Thornton, M. M., Mayer, B. W., Wilhelmi, N., Wei, Y., Devarakonda, R., et al. (2012). Daymet: Daily surface weather on a 1 km grid for North America, 1980–2008. In oak ridge national laboratory (ORNL) distributed active archive center for biogeochemical dynamics. Oak Ridge, Tennessee, USA: ORNL DAAC.
Wermelinger, B. (2002). Development and distribution of predators and parasitoids during two consecutive years of an Ips typographus (Col., Scolytidae) infestation. J. Appl. Ent. 126 (10), 521–527. doi:10.1046/j.1439-0418.2002.00707.x
Keywords: bark beetles, climate change, Dendroctonus brevicomis, forest disturbance, forest recovery, Pinus ponderosa, tree mortality, Sierra Nevada
Citation: Robbins ZJ, Xu C, Jonko A, Chitra-Tarak R, Fettig CJ, Costanza J, Mortenson LA, Aukema BH, Kueppers LM and Scheller RM (2023) Carbon stored in live ponderosa pines in the Sierra Nevada will not return to pre-drought (2012) levels during the 21st century due to bark beetle outbreaks. Front. Environ. Sci. 11:1112756. doi: 10.3389/fenvs.2023.1112756
Received: 30 November 2022; Accepted: 20 February 2023;
Published: 14 March 2023.
Edited by:
Donghai Wu, Cornell University, United StatesReviewed by:
Ying Deng, Institute of Botany (CAS), ChinaYitong Yao, California Institute of Technology, United States
Copyright © 2023 Robbins, Xu, Jonko, Chitra-Tarak, Fettig, Costanza, Mortenson, Aukema, Kueppers and Scheller. This is an open-access article distributed under the terms of the Creative Commons Attribution License (CC BY). The use, distribution or reproduction in other forums is permitted, provided the original author(s) and the copyright owner(s) are credited and that the original publication in this journal is cited, in accordance with accepted academic practice. No use, distribution or reproduction is permitted which does not comply with these terms.
*Correspondence: Zachary J. Robbins, zjrobbins@lanl.gov